
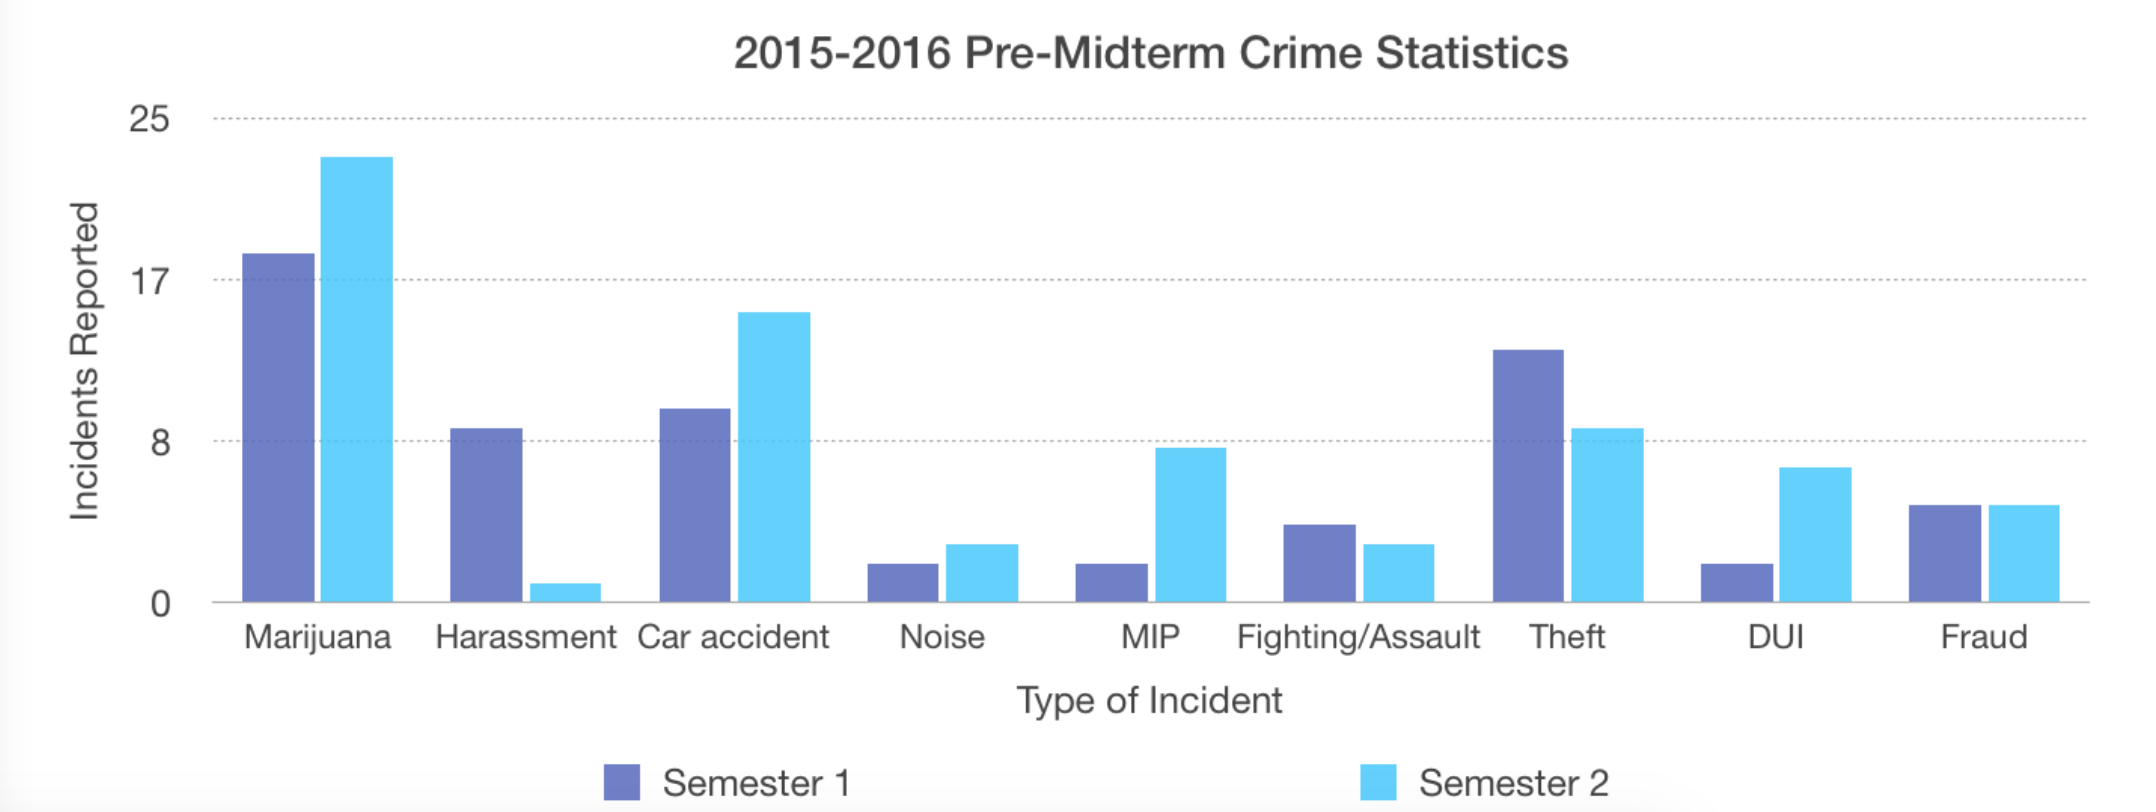
The numbers reflected on the graph below were gathered from the middle six weeks of the first half of each semester this year.
The chosen categories are the most commonly occurring crimes that appear in On the Record each week. These numbers are not indicative of individual people, rather the number of times each type of incident was reported and/ or investigated.
Although the weekly reports are provided by the Ferris Department of Public Safety, they are not responsible for the total numbers displayed on the graph. This information is strictly dependent upon analysis of the Torch’s own the Record reports.
To see the weekly On the Record reports, click here.